Trading Strategies
Utilizing statistics and volatility for effective day trading solutions.
Statistics PROVE that the markets are reliable and exploitable.
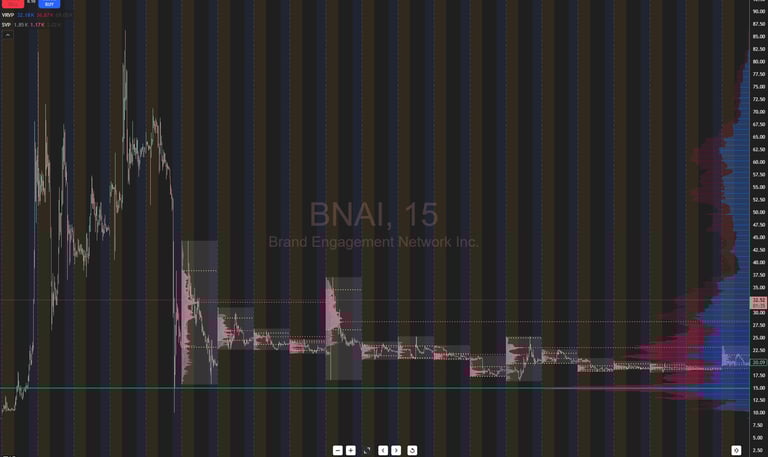
The market is far more predictable then you think. Profiling and Value are the key tools we use to identify the best levels and the best trades everyday. If you don't know where orders maybe sitting relative to new order flows your trading in the dark
Volatility is the ingredient that you lack to give you consistent reliable results
Our custom indicator will ADAPT to all market volatility and keep the framework of the strategy solid and profitable.

After taking the One on One coaching I achieved the consistency I craved from trading. In 11 years nothing else has worked this well for me
John D.

I tried so many other trading services but nothing has produced the results I get from trading with the tools they provided me in the coaching.
Sarah T.

★★★★★
★★★★★
Trading
Simplifying day trading with statistical insights.
© 2025. All rights reserved.