Master Day Trading with Statistical Insights

Simplifying day trading through statistics and volatility analysis for smarter trading decisions.

Empowering Day Traders with Statistics

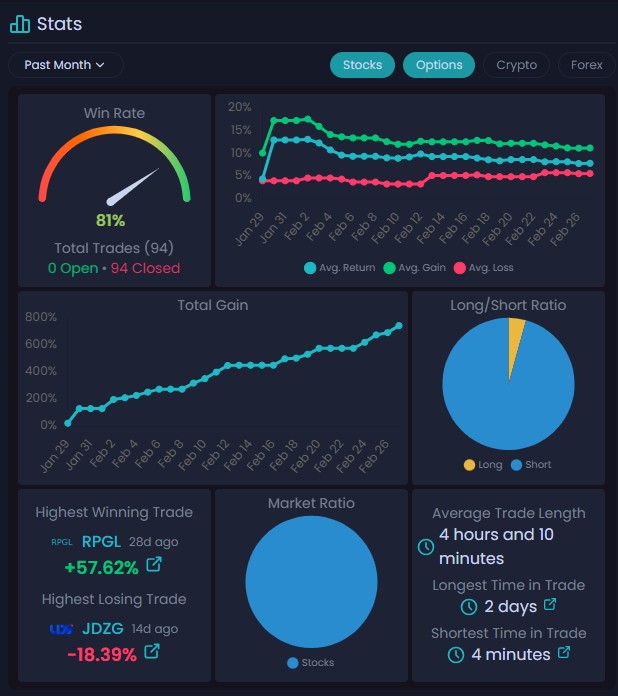
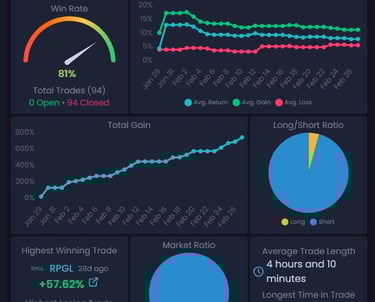
At Statistical Volatility Trader, we simplify day trading by leveraging statistical analysis and volatility metrics, making it accessible and quantifiable for traders of all experience levels.

A laptop displays a financial trading platform with a candlestick chart showing stock market data. The chart is colorful, with blue and orange bars representing volume, and fluctuating lines indicating stock prices over time. Surrounding the laptop are two small potted plants on a white surface.

150+

15

Trusted by Experts

Proven Results

Day Trading With Powerful Data Driven Tools

Experience day trading made easy with our statistical and volatility-driven strategies for success.

Statistical Insights

Leverage data-driven insights to enhance your trading decisions by using statistical LEVELS for Entries , Stops and Targets
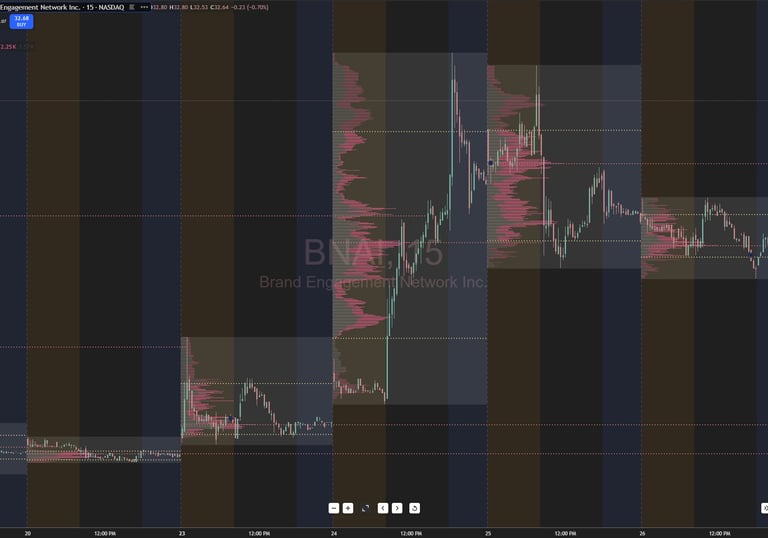
Volatility Analysis

Understand market fluctuations and utilize volatility. If your trading without proper volatility analysis you will always be getting stopped out and trading the wrong size.

Our head Trader and founder has more then 45 years experience and has worked as a Floor Trader and Consultant to some of the worlds largest investment banks.

Expert Guidance
A computer monitor displays a cryptocurrency exchange interface with various graphs, charts, and numerical data. On the left side, there are options for buying and selling, as well as a list of recent trades. The main graph on the right shows a price chart with a candlestick pattern, indicating fluctuations in the market over a period of time.

Statistical Volatility's One on One Coaching transformed my day trading experience. — I was tired of losing money following out dated subjective trading strategies. Once I changed my process to data driven strategies the money was consistent and reliable and I could finally see real results that worked.

Kevin Yu

A digital stock market ticker displaying the SPY index value at 452.65, alongside a graphical representation of market performance with green and red indicators. The numbers 2.16 and 0.48% suggest a percentage change. The image uses bright LED-like dots for visual impact against a dark background.
A person is holding a smartphone displaying a financial trading app. The screen shows a candlestick chart with various trading metrics, including the current price, percentage changes, and buttons for different actions. The person's hands are visible, and a black background accentuates the smartphone screen.

★★★★★

DM Head Trader in Discord for Coaching

A hand holds a smartphone displaying a financial chart with candlestick patterns. In the background, a large, similar financial graph is visible on a screen, featuring fluctuating lines and data points.

Apply for our 2 month One on One Coaching program with our Head Trader. Please tell us a little bit about your trading experience, your age and time available to learn and master statistics and volatility.